|
Life Cycle Perspective |
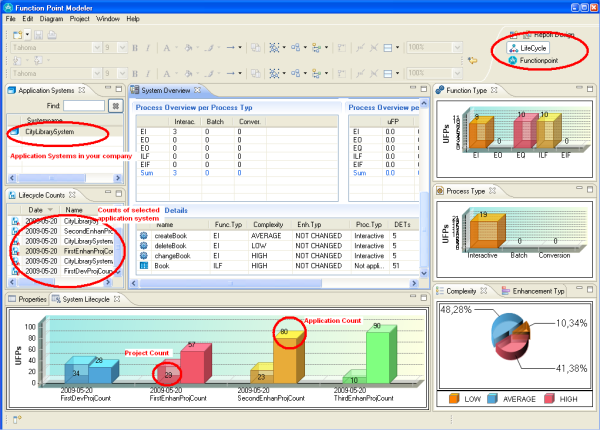
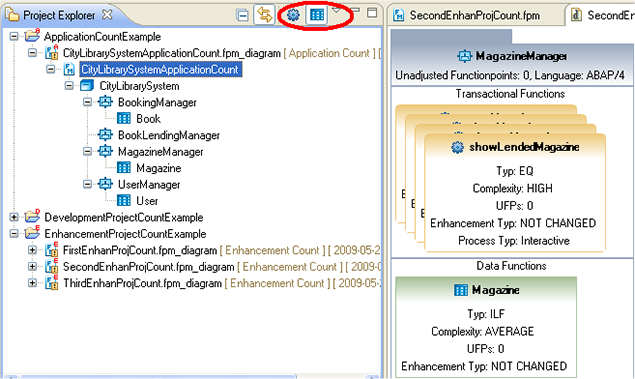
You can now view the life cycle of application systems in your company. The Life Cycle Perspective shows you each function point analysis detail from the first development of the application system till current application system count . The Life Cycle Perspective includes a lot of views for the counts and sub system of an application system.
|
|
Quick Life Cycle |
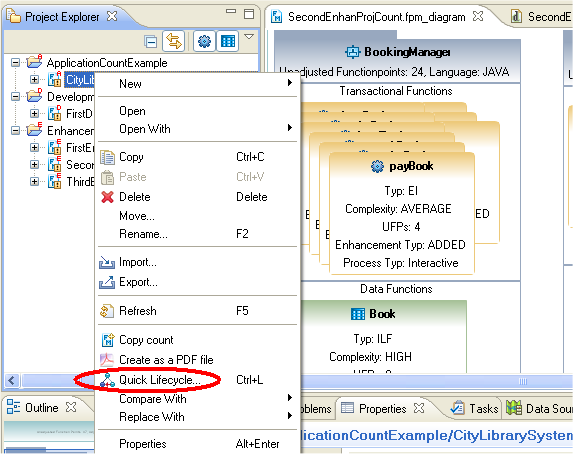
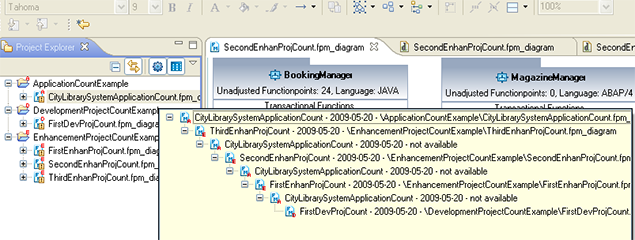
The Quick Life Cycle give you historical overview of the selected count ( development project count > application count > enhancement project, etc. ). You can start the Quick Life Cycle Ctrl+L. You can start Quick Life Cycle from the context menu. You can also use the keyboard shortcut Ctrl+L .
You can also select a count from Quick Life Cycle View to open it in diagram editor.
|
|
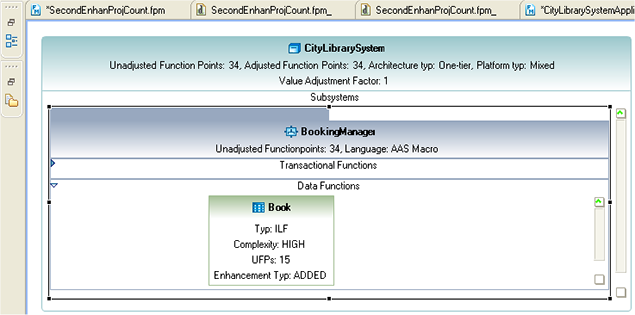
Transactional Function and Data Function Filter |
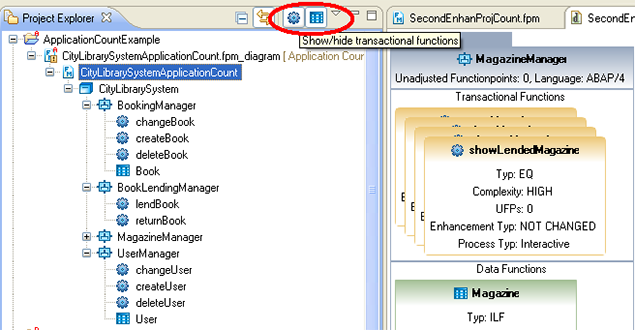
Function Point Modeler 3.1 now allows
you to show or hide
the
transactional functions
and
data functions
in
a count.
The transactional functions of a count are hided in the following screen shot.
|
|
Defining your favorite Line Color and Fill Color in the Editor |
The Window > Preference > Connections > Function Point Modeler > Diagram >Appearance page allows you to specify the line colour of each item separately.
|
|
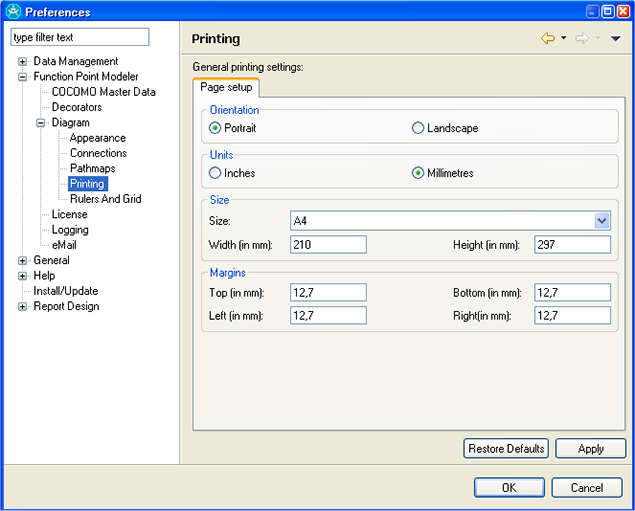
Defining your setting |
The Window > Preference > Connections > Function Point Modeler > Diagram > Printing page allows you to specify you print setting.
|
|
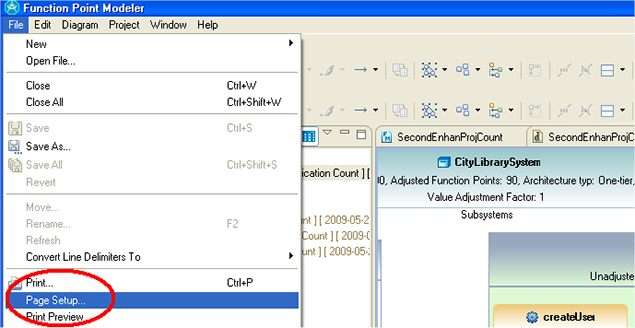
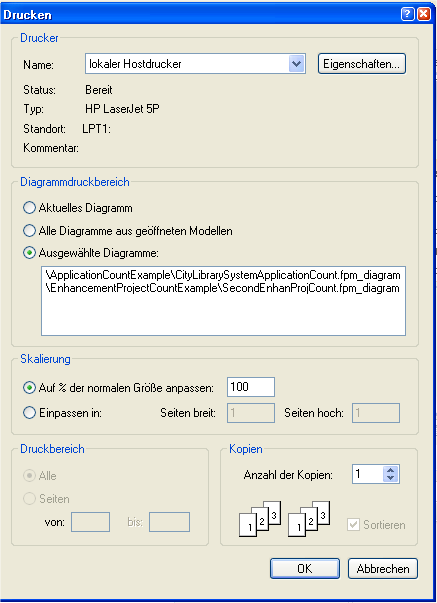
Print your Function Point Modeler diagram |
Standard printing features are now
available for printing
Function
Point Modeler
diagrams.
You can also specify which diagrams you want to print and how to scale them to fit on the paper.
|
|
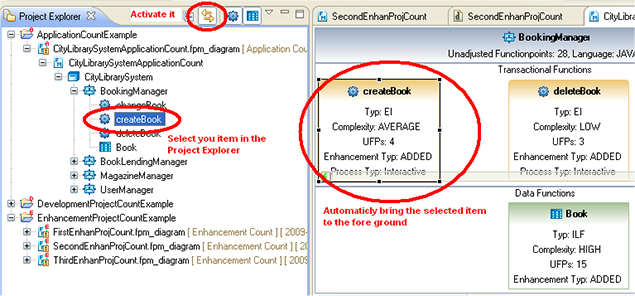
Linking the Navigator view to the active editor |
When you have multiple files open for editing, you can configure one of the navigation views to automatically bring an open file to the foreground (make its editor session the active editor) every time you select that open file in one of the navigation views.
|
|
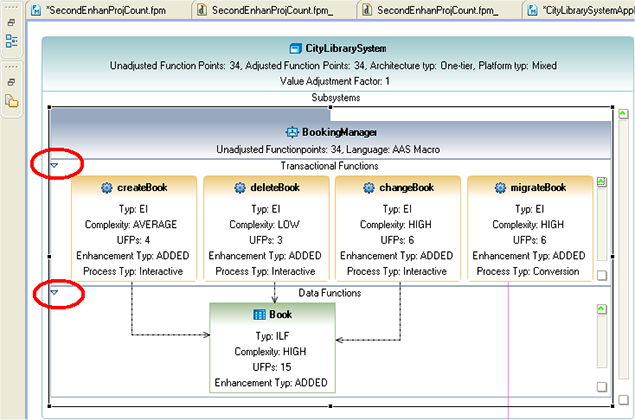
Collapsing compartments |
You can collapse a compartment in a data diagram to a minimal size to allow more space for the other compartments in a shape.
After the Transactional Functions compartment is collapsed.
|
|
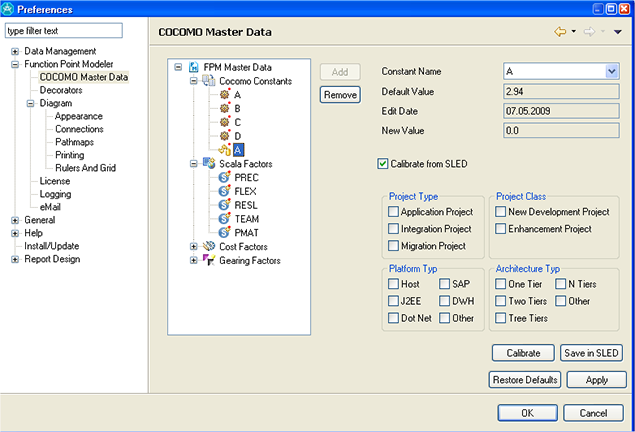
Calibrate or set new vale of COCOMO constants . |
Function Point Modeler Advanced Enterprise 3.1 Cocomo II tool now allows you to calibrate or set the new value of COCOMO constants. You can use the for your company calibrated constants in your estimation.
|
|
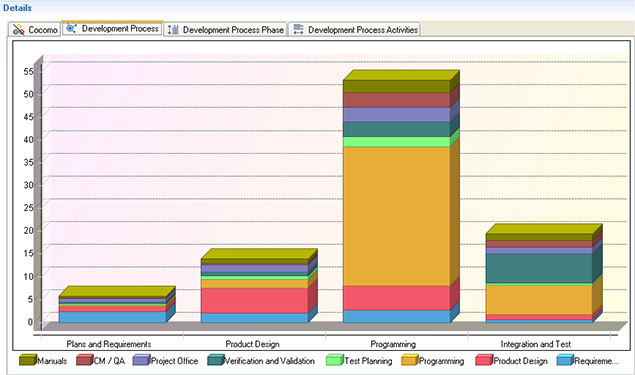
Project estimation calculated based on the RUP |
Function Point Modeler Advanced Enterprise 3.1Cocomo II tool supports Rational Unified Software Development Process.
|
|
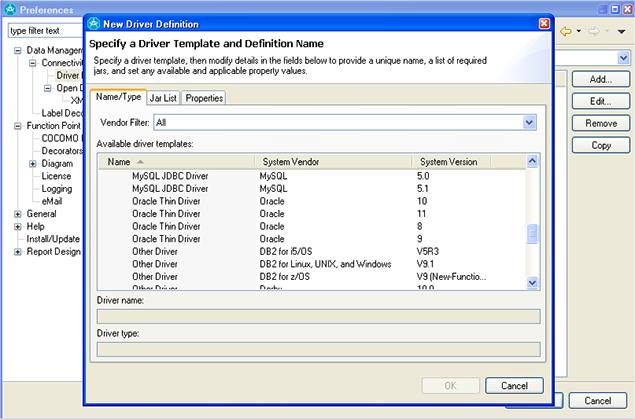
Database support extended |
Function Point Modeler Advanced Enterprise 3.1 now supports all well-known database vendors for your SLED.
|
|
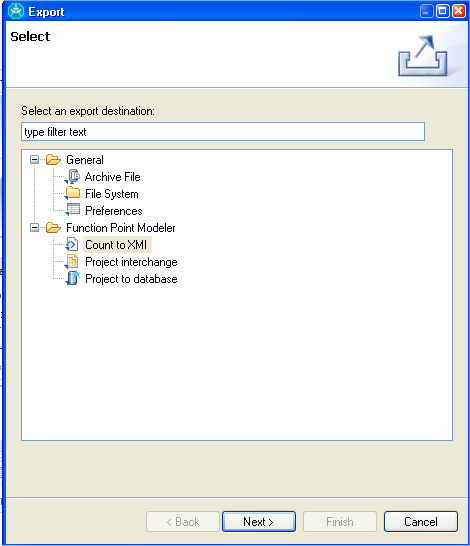
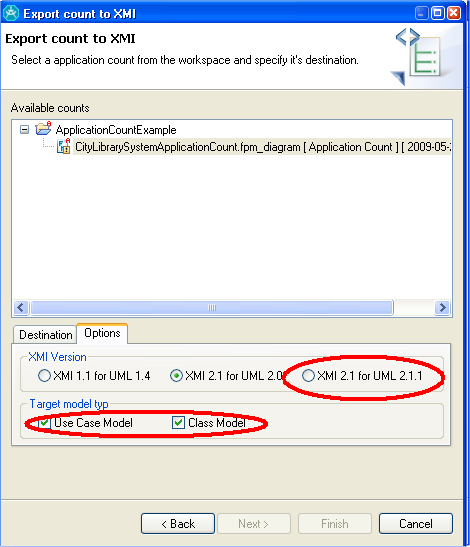
XMI 2.1 for UML 2.1.1 for example IBM RSA |
Function Point Modeler Advanced Enterprise 3.1 now supports XMI 2.1 and UML 2.1.1 export/import.
You can also export your Function Point Model as Business Object Model to any UML tool.
|
|
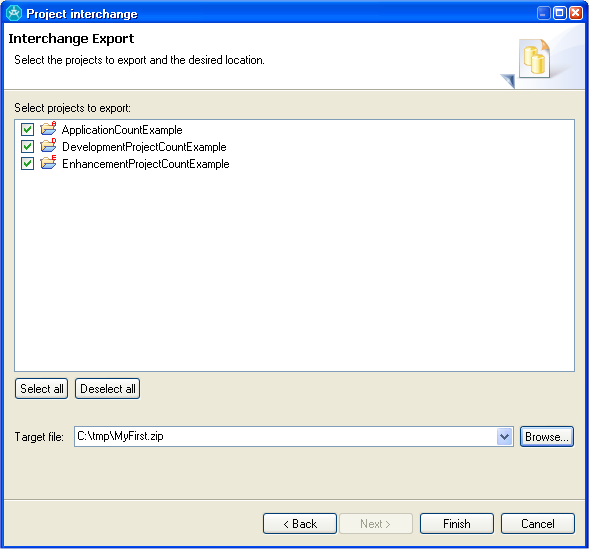
Project Interchange to export & import projects |
Sharing projects using Project Interchange. If you are not using SLED database you can use the Project Interchange feature to share your project in the Function point Modeler You export projects into ZIP files, which can be imported.
|
|
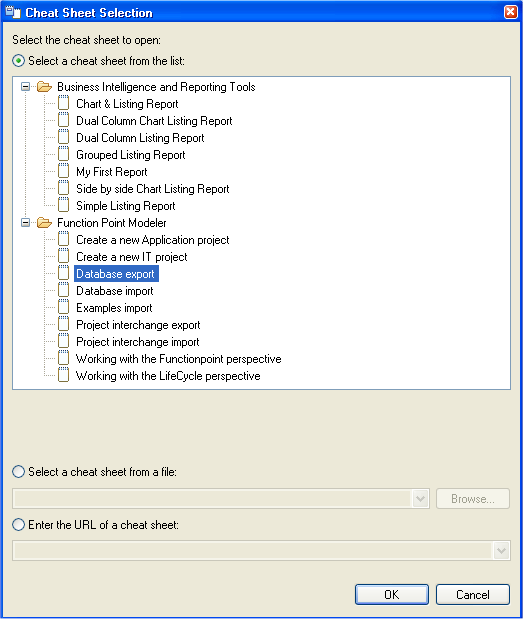
Cheat Sheets |
Function Point Modeler 3.1 provides cheat sheets to guide you through some of its function point counting and report designer processes. Each cheat sheet is designed to help you complete some task, and it lists the sequence of steps required to help you achieve that goal.
As you progress from one step to the next, the cheat sheet will automatically launch the required tools for you. If there is a manual step in the process, the step will tell you to perform the task and click a button in the cheat sheet to move on to the next step.
|
|
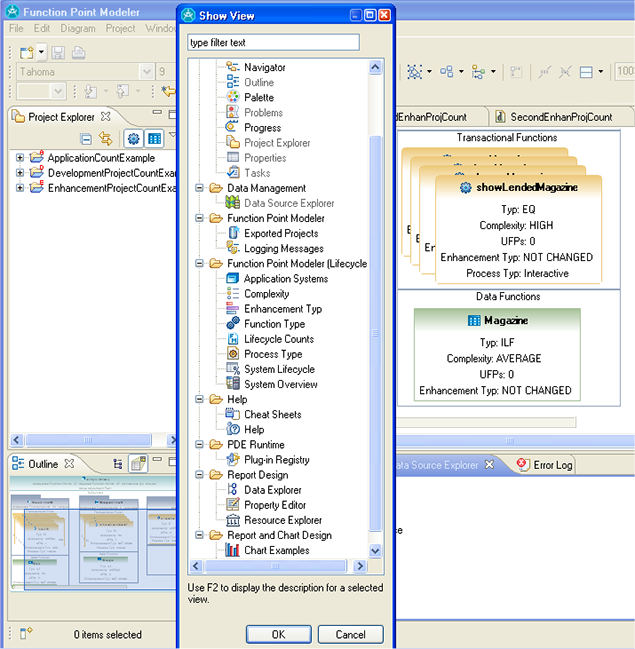
More Views |
Function Point Modeler 3.1 includes a lot of useful views
|
|
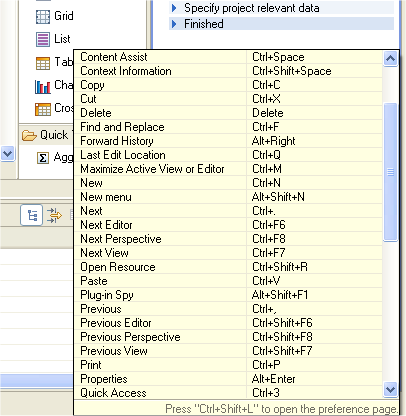
Key Assist |
This command will display a list of key bindings
|
|
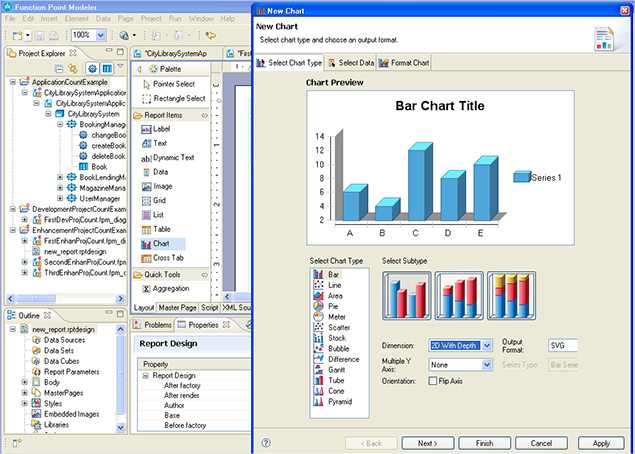
FPM Report Designer and mor useful features |
Function Point Modeler Advanced Enterprise 3.1 Report Designer is now more powerful than ever. You can now create more complex reports using the FPM Report Designer Chart Wizard.
|