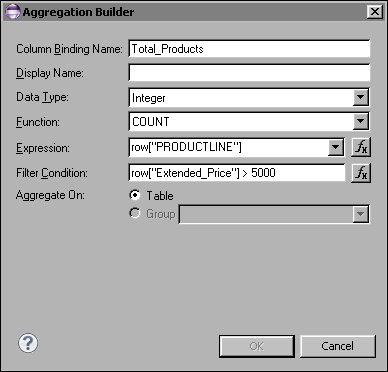
How to display aggregate data
1 In the palette, under Quick Tools, drag an aggregation element and drop it in the header or footer row of a group or a table.
2 In Aggregation Builder, specify the following information:
1 In Column Binding Name, type a unique name. Remember, for each piece of calculated data to display in a report, there must be a column binding. The column binding name appears in the report design if you do not specify a value for the next option, Display Name.
2
If performing an aggregate calculation on values other than values in a data set field, type an expression. You can open the expression builder to get help constructing an expression.
6 In Filter Condition, specify the filter condition to use to determine which rows are factored in the aggregate calculation.
Select a specific group to perform the aggregate calculation over all the rows in the selected group.Figure 9-1 shows an example of a complete definition for an aggregation element. In the example, the element returns the number of rows in the table, where the extended price of the product is greater than $5,000.00.Figure 9-1 Aggregation Builder displaying values for getting the count of products in the tableIn the report design, the aggregation element displays the sigma symbol followed by the column binding name, as shown in the following example:
(c) Copyright Actuate Corporation 2012 |