|

|
|
|
|
Task 5: Lay out the report
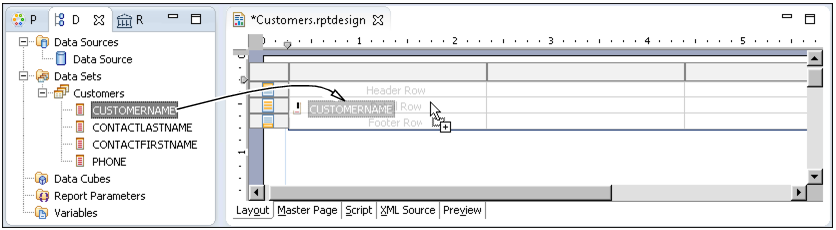
In this procedure, you insert elements in the report page to display the data from the data set that you created previously. You start by inserting a table element, then you insert data elements in the table. It is important to understand the functionality that the table provides. The table:
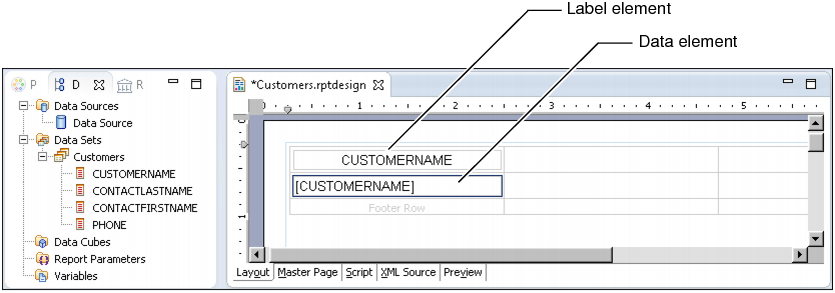
Figure 1-14 Dragging a column from Data Explorer, and dropping it in a table cellIn the layout editor, the table cell in which you dropped the CUSTOMERNAME field contains a data element that displays [CUSTOMERNAME]. Above this data element is a label element that the layout editor automatically added to the header row. This label displays the field name as static text. It serves as the column heading. Figure 1-15 shows the data and label elements.
Figure 1-15 Data and label elements in a table
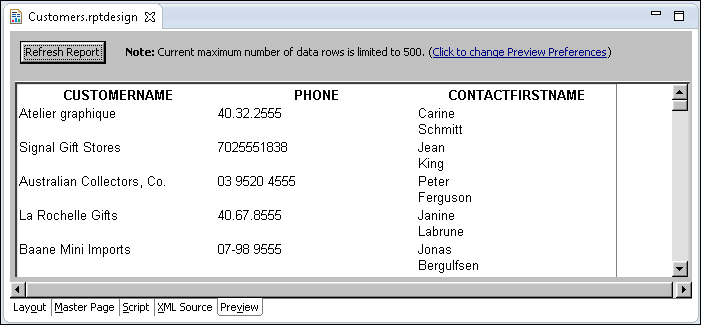
Figure 1-17 Preview of report data
| (c) Copyright Actuate Corporation 2012 |