|

|
|
|
|
Task 1: Set up and query the data source
Before you start to design a chart, you must create a report design file for the chart, then set up the data source and data set that the chart uses. These tasks are discussed in detail in earlier sections of this book and in a tutorial in which you build a sample report. This tutorial builds on that knowledge. This task shows how to select the data to build a sample pie chart.
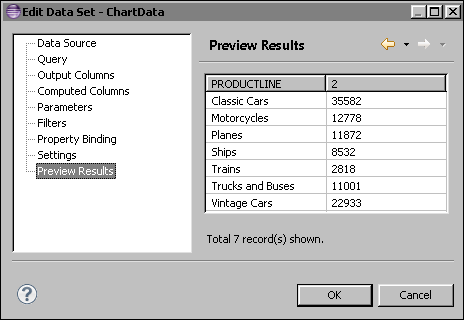
Figure 14-1 Previewing the data setThe first column lists product line names. The second column shows the total orders for each product line. BIRT uses sequential numbers to name generated columns, such as the sum column named 2 in Figure 14-1.
| (c) Copyright Actuate Corporation 2012 |