|

|
|
|
|
Task 2: Add the chart to the report
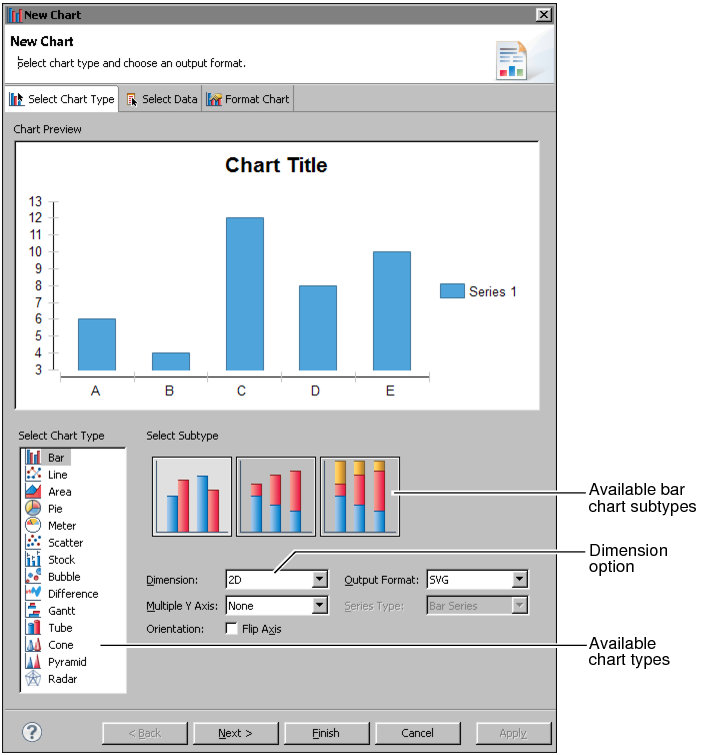
In this task, use the palette to add a chart element, and select a chart type.
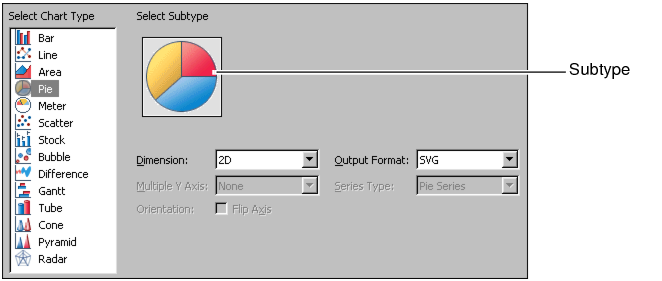
Figure 14-2 Selecting the chart typeThe lower part of the Select Chart Type page displays the different types of charts that you can create. Some chart types include several subtypes, giving you a wide range of available types. Choosing a chart type on Select Chart Type displays the available subtypes for that type of chart. By default, these subtypes create two-dimensional charts.
| (c) Copyright Actuate Corporation 2012 |