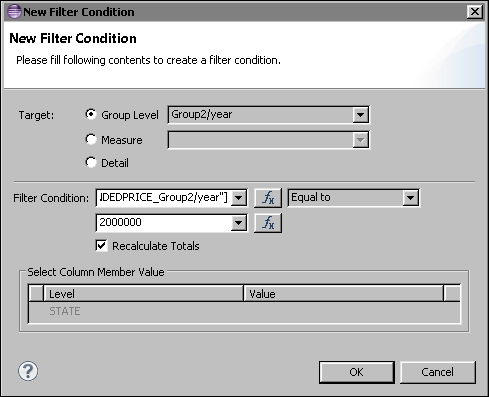
How to filter data at the cross tab level
Choose Group level to filter data in a specific dimension, then select a group. For example, if the cross tab displays sales totals by product line and by year, you can create a filter to display data for certain product lines or for certain years.
Choose Measure to filter measure data, then select a measure. For example, you can create a filter to display sales totals greater than a specific number.
Choose Detail to filter on a field that is not used in the cross tab, but that is defined in the cube.In Filter Condition, the first field displays the expression of the selected group or measure. You can change this value.
1 In the first field, select a dimension or a measure, or a group total for which to evaluate values. Alternatively, choose the expression builder button to create an expression.
3 In the third field, specify the value to search in the dimension or measure specified in the first field. You can type a value, or choose <Select value...> to display a list of values. You can also specify an expression that evaluates to a value.Figure 17-14 shows an example of a complete filter condition. The filter limits the data to only the years where the annual sales exceed 2000000. The annual sales is calculated by the data field, EXTENDED_PRICE_Group2/year.Figure 17-14 New Filter Condition showing an example of a complete filter condition
(c) Copyright Actuate Corporation 2012 |