|

|
|
|
|
Task 5: Add a cross tab to the report
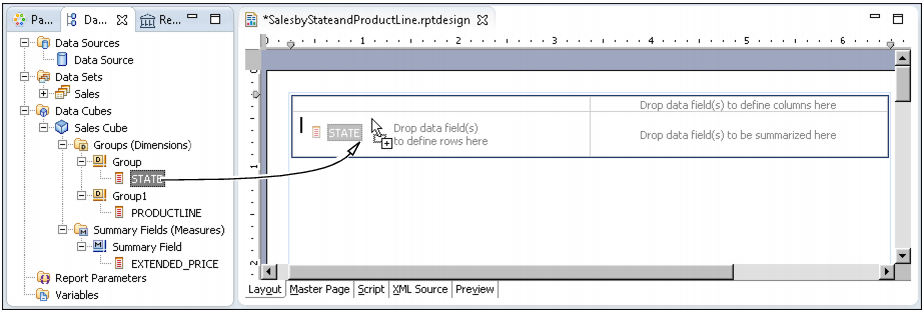
In this procedure, you add a cross tab to the report, then you insert data from the cube into the cross tab.
Figure 17-8 Inserting STATE data in the cross tab
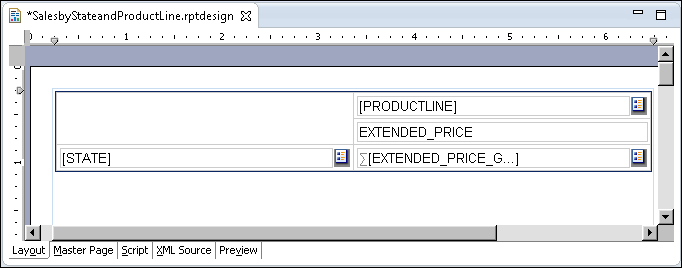
Figure 17-9 Cross tab design
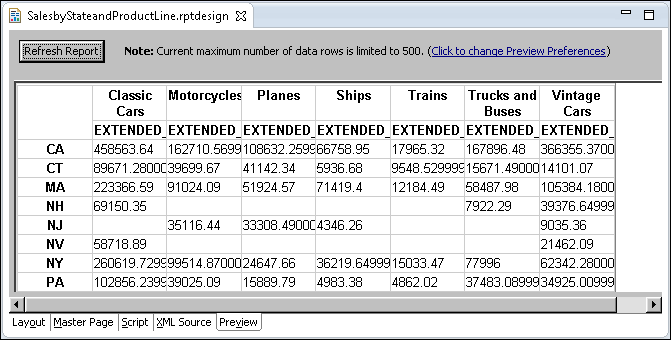
Figure 17-10 Preview of the cross tab dataThe row headings display the states, the column headings display product lines, and the cells display the sales totals. The first cell displays 458563.64, which is the sales total of classic cars sold in California.
| (c) Copyright Actuate Corporation 2012 |