|

|
|
|
|
Task 8: Format the report
Now that the report displays the correct data, focus on improving the report’s appearance. You perform the following tasks in this section:
Adjust the column widths
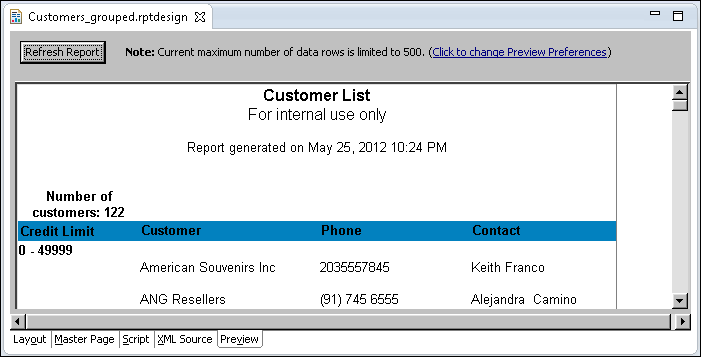
When you insert a table, BIRT creates columns with equal widths. In this report, you can improve the layout by decreasing the width of the credit limit column, and increasing the width of the customer column. If you view the entire report, you see that some of the customer names extend to the edge of the column and one name is truncated.
Figure 8-21 Report preview showing adjusted column widthsRemove credit limit data from the detail rows
To verify that data appears in the correct credit limit groups, it is useful to display each customer’s credit limit. Now that you have verified the data, delete the individual credit limit information from the report.
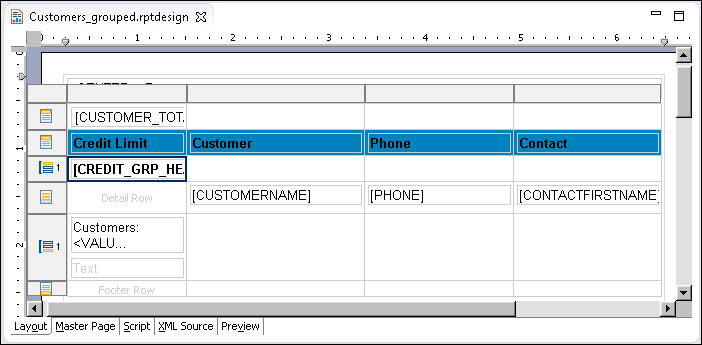
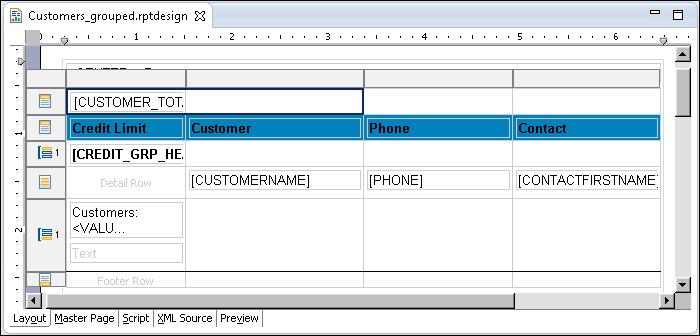
Figure 8-22 Report preview showing credit limit data removed for each rowDisplay group headings on the first row of each group
The credit limit group headings appear in their own rows, above the detail rows of each group. In this procedure, drop the group headings so that they appear in the first detail row of each group.
Figure 8-23 Group heading cell selected
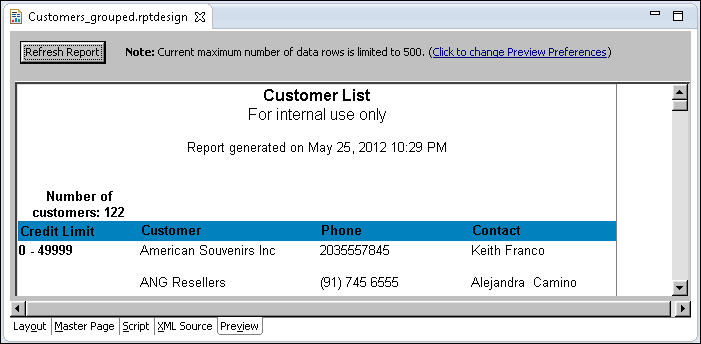
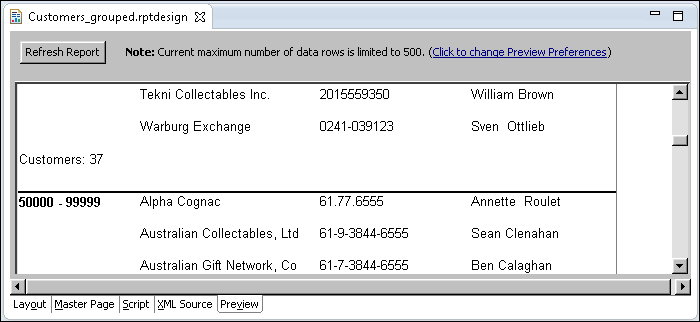
Figure 8-24 Report preview showing dropped group headingsSeparate each group with a line
Drawing a line to separate each group makes it easier to see each data group.
Figure 8-26 Report preview showing a line between groupsDisplay the number of customers text on one line
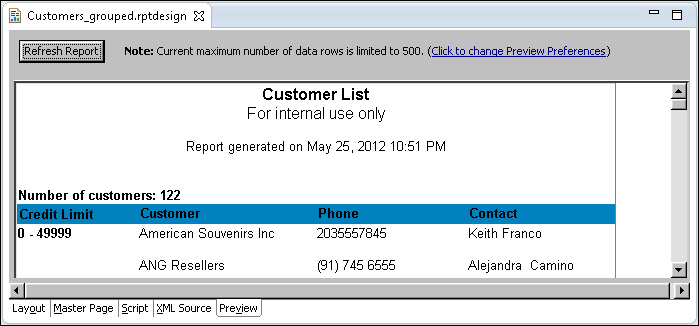
The text at the top of the table appears centered within the first column. In this procedure, you format the text so that it appears left-aligned and on one line.
Figure 8-27 Two cells in the top table header row selected
Figure 8-28 Report preview showing Number of customers: 122 on one line
| (c) Copyright Actuate Corporation 2012 |