|

|
|
|
|
Task 7: Display aggregate information
One of the benefits of grouping data is that you can add summary information at the beginning or end of each group. Summary information is also known as aggregate information. In this procedure, add the following aggregate information to the report:
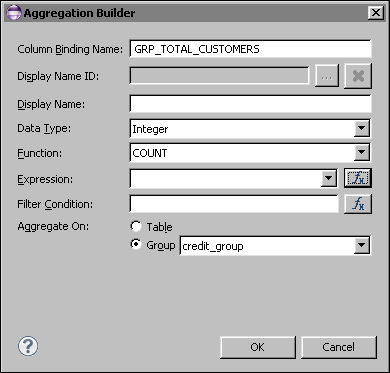
Display the number of customers in each group
Figure 8-10 Aggregation Builder displaying values for getting the count of customers in each credit limit group
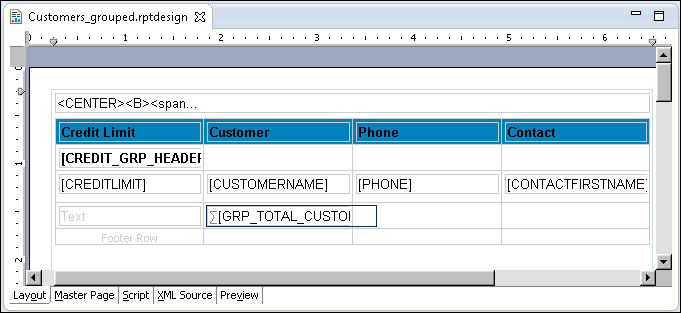
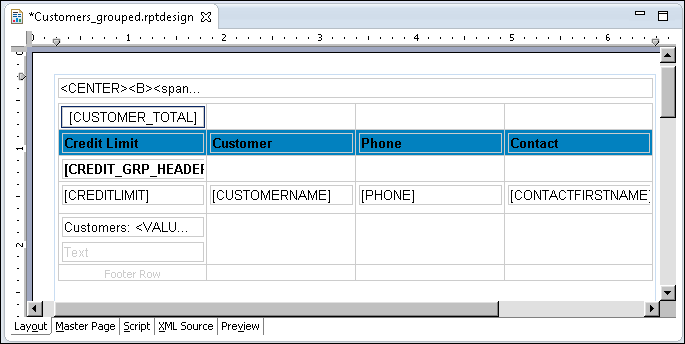
Figure 8-11 Report design displaying the aggregation element
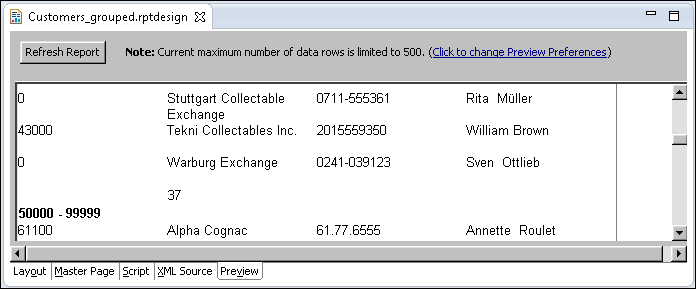
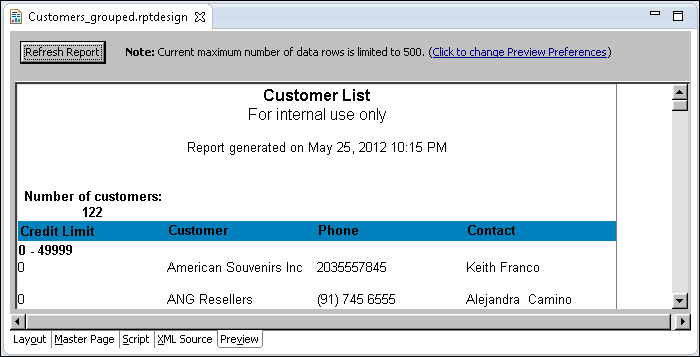
Figure 8-12 Report preview showing a count for each group
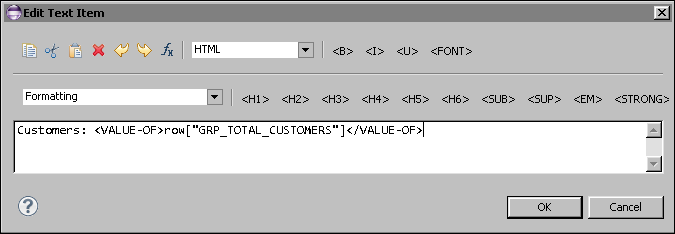
Figure 8-13 Text specified for the text element
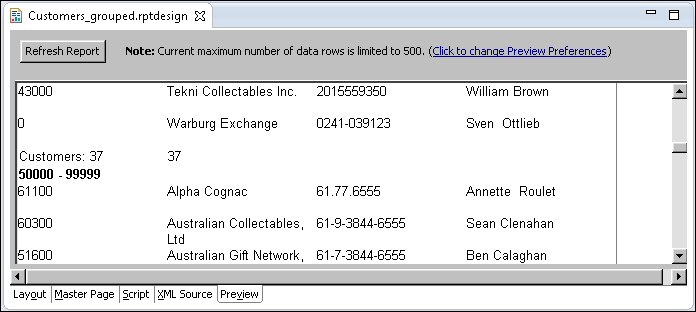
Figure 8-14 Report preview showing the text displayed by the text element
Display the total number of customers in the report
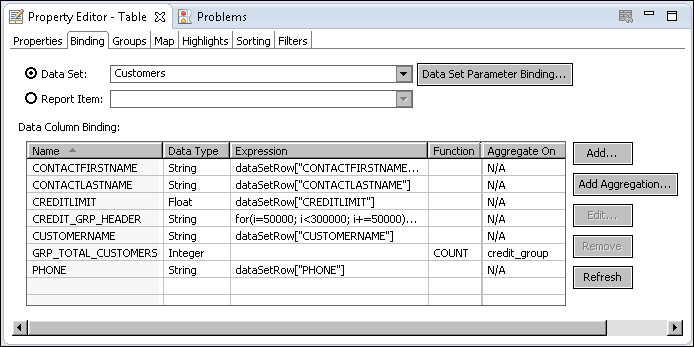
In the previous procedure, you added aggregate data by inserting the aggregation element from the palette. This time, you add aggregate data by creating a column binding through the table’s Binding page.
Figure 8-15 Column bindings displayed
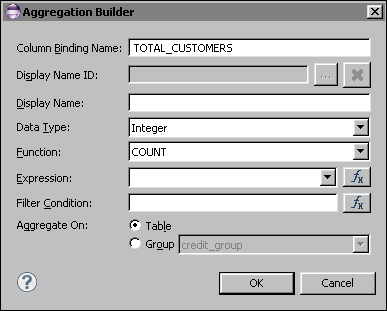
Figure 8-16 Aggregation Builder displaying values for getting the count of customers in the table

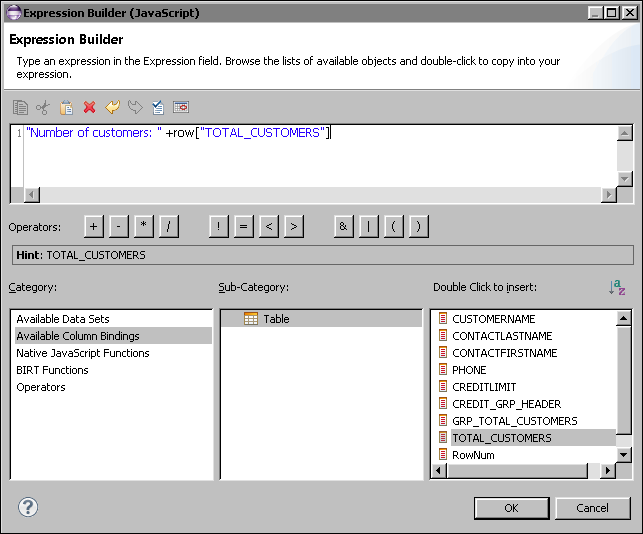
Figure 8-17 The expression builder displaying the expression that refers to the TOTAL_CUSTOMERS column binding
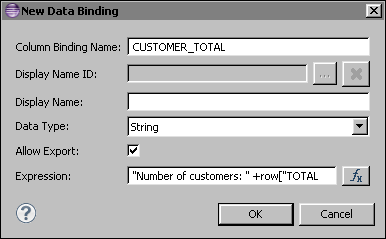
Figure 8-18 Column binding defined
| (c) Copyright Actuate Corporation 2012 |
 [GRP_TOTAL_CUSTOMER]