Previous Next

Task 6:  Display credit limit ranges in the group header

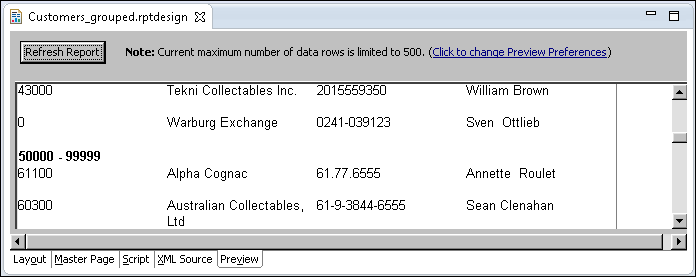
Rather than display the first value of each group in the group header, the report is easier to navigate if it displays the credit limit range for each group, as follows:

0 - 49999
50000 - 99999
100000 - 149999

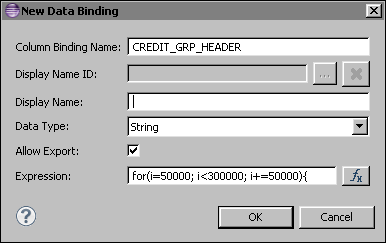
This procedure shows how to write a JavaScript expression to display these credit limit ranges. The procedure also shows how to create a column binding with which to associate the JavaScript expression.

1  
2  
3  
Insert a new data element in its place by right-clicking the cell and choosing InsertData. New Data Binding prompts you to create a column binding for the new data element.
4  
1  
CREDIT_GRP_HEADER

2  
3  
  for(i=50000; i<300000; i+=50000){
  if( row["CREDITLIMIT"] < i ){
    rangeStart = i-50000;
    rangeEnd = i-1;
    break;
  }
  }
  displayString = rangeStart + " - " + rangeEnd;
Choose OK. The expression appears in the Expression field on New Data Binding, as shown in Figure 8-8.

Figure 8-8 Column binding defined

Figure 8-8  Column binding defined
4  
Choose OK to save the column binding for the data element. In the layout editor, the data element displays the column binding name, [CREDIT_GRP_HEADER].
5  
Select the data element. In Property Editor, under Properties, in General, choose B to format the group heading as bold text.
6  

Figure 8-9 Report preview showing credit limit ranges

Figure 8-9  Report preview showing credit limit ranges

(c) Copyright Actuate Corporation 2012